In our last discussion on the “Digital Bottleneck Management Improvement Loop,” we touched upon how digital tools can empower lean initiatives. Today, I’d like to dive into another critical—yet often overlooked—topic: quality loss analysis and quality cost management.
Click the link to watch the full case demonstration video:https://youtu.be/OHiR1bpSV7A
Why Start with Quality?
Compared to equipment-related issues, quality problems tend to involve more dimensions and require a higher level of digitalization. In an era where consistency and reliability are paramount, quality analysis is no longer just about inspection—it’s the first step toward optimization.
Starting from a Production Line’s Data
Let’s take a look at Line 3 in our management system. Analysis of system data shows a clear increase in scrap rate in November compared to October. By drilling down into the daily scrap rate chart, we find that many days exceed the target threshold.
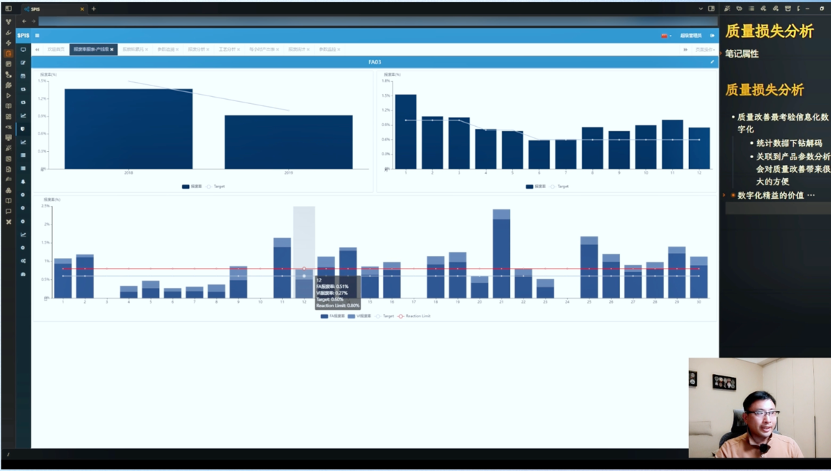
By clicking into the bar chart, we can immediately access the detailed breakdown of each day’s scrap types and their respective proportions.
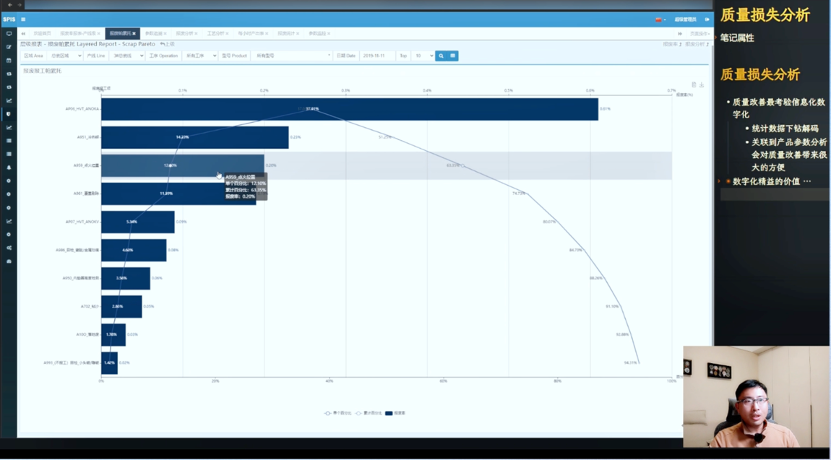
Thanks to this “what you see is what you get” interface, we can zero in on issues like a production supervisor—without needing to switch between different systems. This significantly boosts the efficiency of problem identification.
Scrap Rate Analysis: Zooming In on Models and Processes
Going deeper, the system allows us to analyze scrap by model and time period. For example, on October 29, scrap rate for model A951 surged during the hot riveting process, particularly on machine 521. Further analysis using the hourly output table revealed that this spike occurred shortly after a model change in the morning, and the number of rejected units also increased.
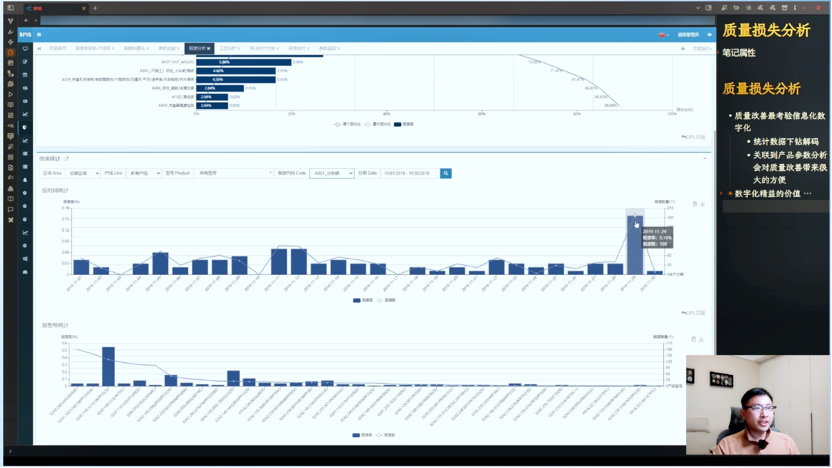
This kind of quickly connected information chain enables us to pinpoint the root cause: could it be that the hot riveting parameters weren’t adjusted in time after the changeover?
Process Parameter Trend Analysis: Lowering the Technical Barrier
To verify this hypothesis, we entered the process parameter analysis page, focusing on the two key hot riveting parameters for Line 3 on the 29th: pressure and frequency.
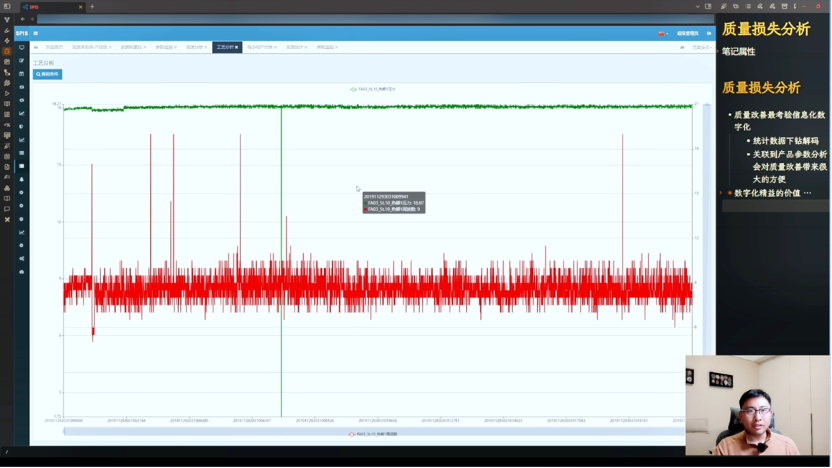
Sure enough, the data showed parameter fluctuations in the morning and a downward trend later in the day. These anomalies are highly valuable clues for engineers. What’s more, they no longer need additional software like Minitab or SPC tools—the entire analysis can be done on the same platform, speeding up root cause identification and resolution.
The system also offers real-time SPC analysis with automatic control value calculations, stability metrics, and alert settings, further strengthening on-site responsiveness.
Lean + Digital: Not Just Efficiency, But Empowerment
This case isn’t just about tracking a quality issue—it’s a demonstration of how digitalization amplifies the value of lean.
Traditional lean emphasizes:
• Problem identification
• Data collection
• Cause analysis
• Closed-loop improvement
With digital lean, everything happens faster and more efficiently. From data collection to information sharing, from analysis to decision-making, each step can be executed in minutes, rather than days or weeks. In our early implementations—like our 2019 project in Nanjing—this speed difference could literally determine whether a company survives or not.
Digital ≠ Replacing People — It Amplifies People
Of course, digital tools are just that—tools. People remain the irreplaceable core. Skilled engineers and supervisors are the key to unlocking the full potential of these tools.
That’s why many American firms love hiring Six Sigma experts—like elite problem solvers for their production lines. But we ask: why not empower your own team? Why not use digital platforms to help your engineers and operators gain those same analytical capabilities?
It’s not just about reducing headcount—it’s about fostering ownership and driving real results on the ground.
Data Transparency: Ending Finger-Pointing, Boosting Collaboration
Another powerful benefit of digitalization is the transparency of data. When everyone works off the same platform and data, communication becomes clearer, blame games disappear, and collaboration becomes more effective. Issues that once required layers of reporting and repeated confirmations can now be pushed to the right people instantly—speeding up resolution significantly.
Data Sparks Curiosity and Fuels Continuous Improvement
Lastly, data is not just a tool—it’s a way to spark curiosity.
Often, it’s not a lack of ideas but a lack of clues that holds us back. Visualization and analytics help us discover opportunities hidden in anomalies: a curve spike, a sudden jump in scrap rate, or a parameter fluctuation—any of these might point to an area for improvement.
When those clues become easily accessible, improvement becomes a natural habit.
Let’s Be Smarter Makers
This was just a small example, but I genuinely hope we can explore more such topics as a team. If there are specific modules or tools you’re curious about, feel free to leave a comment—I’d love to dive deeper.
With the help of digital lean, we can respond more efficiently and intelligently to the pressures of cost reduction and efficiency improvement. And I hope every manufacturing professional can gain a stronger sense of achievement and confidence along the way.
Let’s move forward—together.
Click the link to watch the full case demonstration video:https://youtu.be/OHiR1bpSV7A
Start Now! Improve Order Delivery Efficiency Immediately!
Contact us and explore order delivery efficiency improvement with LinkedData digital transformation experts.
Request a Demo
 0510-8521 1230


